Systematic bias of correlation coefficient may explain negative accuracy of genomic prediction
摘要
基因组预测的准确性一般是基于交叉验证及pearson相关系数来计算。但是有很多negative accuracies(不是特别好翻译,后文都用NA来代表)出现在研究文章中。NA描述的就是当表型和基因型是随机打乱的时候,计算出来的pearson相关系数说描述的准确性,这个值应该是在0左右。文中描述了两种用来计算NA的方法(Hold accuracy和Instant accuracy)。利用真实及模拟数据测试,确定两种方法在不同的条件下确实会有偏。最终还提出了一种对于Instant accuracy方法的一种改进。
Accuracy of genomic prediction is commonly calculated as the Pearson correlation coefficient between the predicted and observed phenotypes in the inference population by using cross-validation analysis. More frequently than expected, significant negative accuracies of genomic prediction have been reported in genomic selection studies. These negative values are surprising, given that the minimum value for prediction accuracy should hover around zero when randomly permuted data sets are analyzed.We reviewed the two common approaches for calculating the Pearson correlation and hypothesized that these negative accuracy values reflect potential bias owing to artifacts caused by the mathematical formulas used to calculate prediction accuracy. The first approach, Instant accuracy, calculates correlations for each fold and reports prediction accuracy as themean of correlations across fold. The other approach, Hold accuracy, predicts all phenotypes in all fold and calculates correlation between the observed and predicted phenotypes at the end of the cross validation process. Using simulated and real data,we demonstrated that our hypothesis is true. Both approaches are biased downward under certain conditions. The biases become larger when more fold are employed and when the expected accuracy is low. The bias of Instant accuracy can be corrected using a modified formula.
主要方法描述
交叉验证(cross-validation)
将样本分成两个不同的部分,一部分用来做training,一部分用来做test。因为样本本身是有正确标签的,用来做test的样本的预测标签和真实标签之前的差异或者一致性可以用来评估模型的好坏,在模型建立及验证中经常使用。
而将这种分成两个部分的实验重复N次,就是N倍交叉验证。常用的有2 fold-cross-validation、5 fold-cross-validation、10 fold-cross-validation。
以2倍交叉验证为例,例如有样本集合[A1,A2,A3,A4,A5,A6],6个样本的样本集合。需要将这个样本集合随机分为2部分(set1=[A1,A3,A6],set2=[A2,A4,A5]),先用set1做训练(或者模型构建),在通过模型预测set2,并计算set2中结果一致性;再用set2做训练,再通过模型预测set1,并计算set1中结果一致性。最终结果来描述模型的好坏。
Instant accuracy
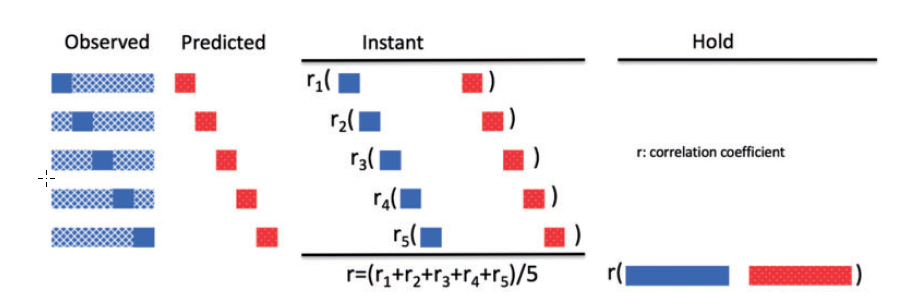
对于交叉验证,之后结果的评估,一种是分别评估一致性(如上所述),再将一致性取平均。
Hold accuracy
另一种则是,将所有的预测结果放到一起,再计算一致性。
图示:
结果
数据描述
- 真实数据:4个真实的样本集,包含SNP集合及最终的表型标记
- 随机数据:利用真实的数据,随机打乱表型标记
- 模拟数据:缺省
Artifactual negative correlation between means of references and inferences
文中一般研究均使用的是5倍交叉验证。所以研究者将其中一套真实数据随机分成5个size相同的集合时,分别统计了这5个集合的表型值(吐丝时间:连续值),结果如下图所示:
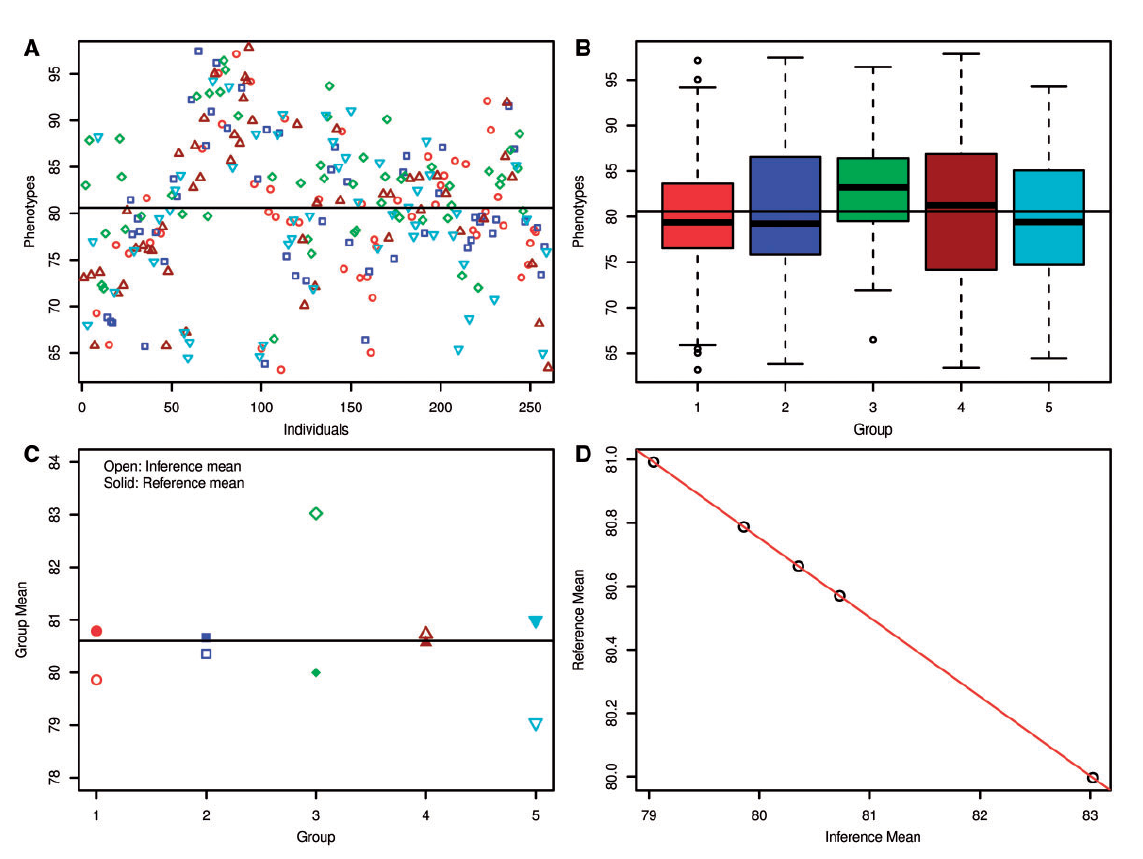
Negative correlation between means of references and inferences in cross-validation. The phenotype evaluated was flowering time, measured as DTS, from 260 maize inbred lines. The flowering-time phenotypes were randomly clustered into five evenly-sized groups, indicated by different signs (A). The phenotypic distribution for each group is illustrated in (B). The group numbers in (B) match the group numbers in (C). The signs in (C) match the group signs in (A). The means of inferences are indicated by open signs (C). The means of the other four groups as references are indicated by the filled signs for each inference group. The means of inference and reference are 100% negatively correlated (D).
这个描述其实我觉得多余,因为是同一个数据集,当把大的数作为set1的时候,那么set2里的数自然更小。所以他们就是会呈现出一种负相关。
Negative bias of hold accuracies
遗传性评估:就是将training set训练出来的模型,直接作用training set,然后看结果一致性
如前一小节所说,如果training set中的表型均值越大,那么test set中的表型均值则越小。又因为training set中的表型均值更大一些,所以所训练出来的模型就更倾向于预测test set更大的值。有这些关系可以推断出,如果直接使用Hold accuracies进行评估,本身就会有一些负相关偏好在其中。其结果如下图所示:
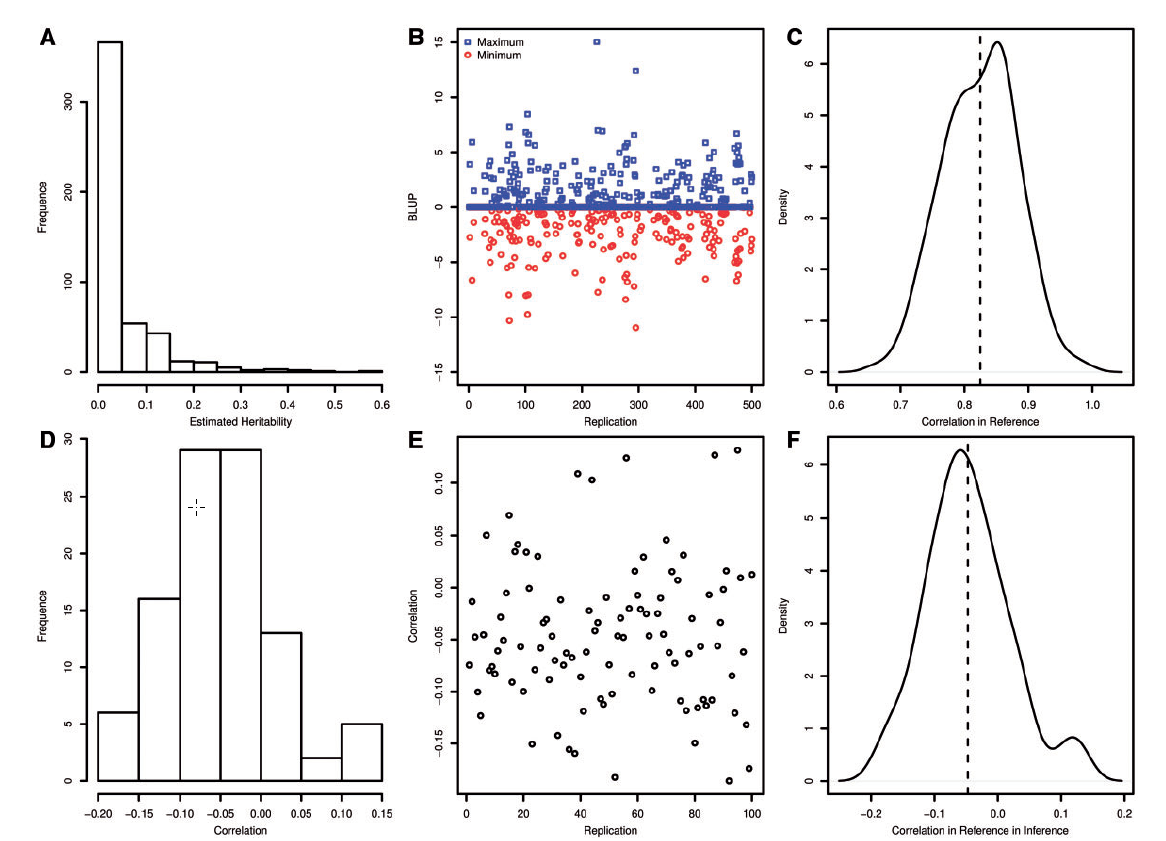
ABC图表示的训练出的模型对training set作用所获得的结果。DEF则是对test set作用所获得结果。
能从F图中看出,利用Hold accuracy的确会有一个偏好。
More fold leads to more bias using hold accuracy
利用交叉验证,使用的倍数越多(More fold),则偏好越大,如下图所示:

Differences in prediction accuracy between Hold and Instant approaches
We extended our examination to scenarios with expected prediction accuracies above zero by using phenotypes simulated from real maize genotypes.
这一部分我的理解是:对于一个数据集,本身是有真实表型的(假设SNP及表型集是100%相关的),然后将本身的真实表型部分打乱,最终达到一个相关度0.125~0.75。然后在按照之前的方法进行分析,同样还会逐步改变样本数目。结果如下图所
示:

可以发现,这些条件的变化,Instant accuracy都要比Hold accuracy要高。而且在同样的继承性的条件下,样本数目越多,准确度越高。
Problems unique to Instant accuracy
前几小节的结论都是Instant accuracy的结果要比Hold accuracy好。但也不是代表Instant accuracy没有问题。由于它是分每一次做一个相关性,然后计算相关性的均值。由于本身pearson相关系数的特性,就是对于小样本量,相关系数会有偏(Fisher大
神说的),所以当样本量很少的情况下,Instant accuracy结果就会出现问题。如下图所示:
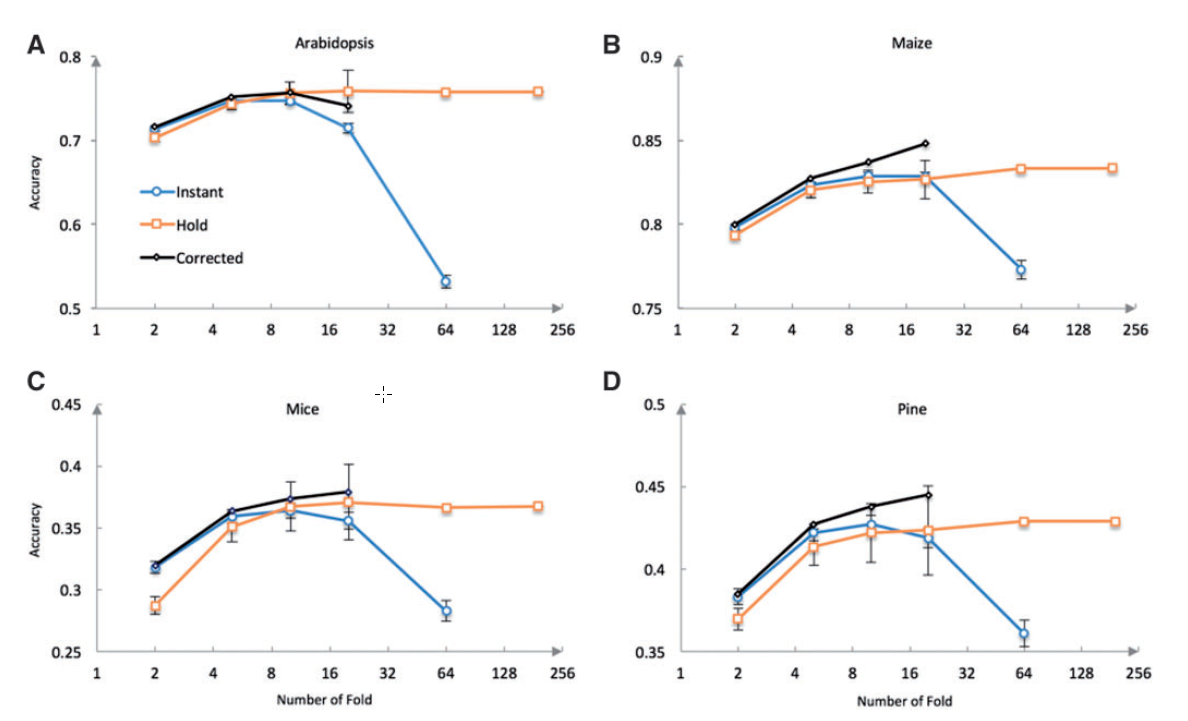
从上图中,可以发现,随着fold数目的增加,test set中的样本越来越少(fold数越多,相当于将样本集平均分成了多少份)准确性会下降。而且这种下降不是由于模型出问题(因为training set的样本数大,所以模型应该是更好的),而只能是算法出现了问题。
Correcting Instant accuracy toward unbiased estimation
文中使用了一个矫正方法(并非作者发明,而是之前其他人发表,但是并没有用到这项评估中,所以作者提议以后加入这项矫正),结果就要好的多,但是因为是计算pearson相关系数,所以还是有一定的数目限制,至少test set中要包含5个样本以上。结果如上图中的黑线。
矫正公式如下:
其中n为样本数,r为pearson相关系数
讨论
Biased Hold accuracy under the null hypothesis
前人研究中只是展示了偏好,但是并没有分析出原因。
Take Home Message
- 因为几乎没有做过此类研究,所以算第一次看到用相关系数来评判模型好坏的文章,之后如果用于机器学习,regression可以尝试用这种方法来评估性能。
- 有些差异就是机器学习的regression都是利用差值来进行寻找最小误差,从而获得最优模型。最终评估结果也是利用差异大小来评估,使用差值就不存在Instant accuracy和Hold accuracy了。
上述是一样的。所以利用差值是不存在这种情况。以后如果做类似的工作,可以试试使用pearson相关系数来进行结果评估。